Event JSON
{
"id": "ac7507487607fbd95572d9739c4ab4dd2188fbe35a6ddbf4dbea9b86cb132779",
"pubkey": "ba5d6903dcdca5691dd2f47317850c880dd3b5fe099901b95309e8d920e07f31",
"created_at": 1774798434,
"kind": 1,
"tags": [
[
"proxy",
"https://mastodon.social/@urlyman/116313190220725100",
"web"
],
[
"t",
"climatediary"
],
[
"imeta",
"url https://files.mastodon.social/media_attachments/files/116/313/243/214/498/410/original/458629fa35f6afa3.png",
"m image/png"
],
[
"proxy",
"https://mastodon.social/users/urlyman/statuses/116313190220725100",
"activitypub"
],
[
"L",
"pink.momostr"
],
[
"l",
"pink.momostr.activitypub:https://mastodon.social/users/urlyman/statuses/116313190220725100",
"pink.momostr"
],
[
"-"
]
],
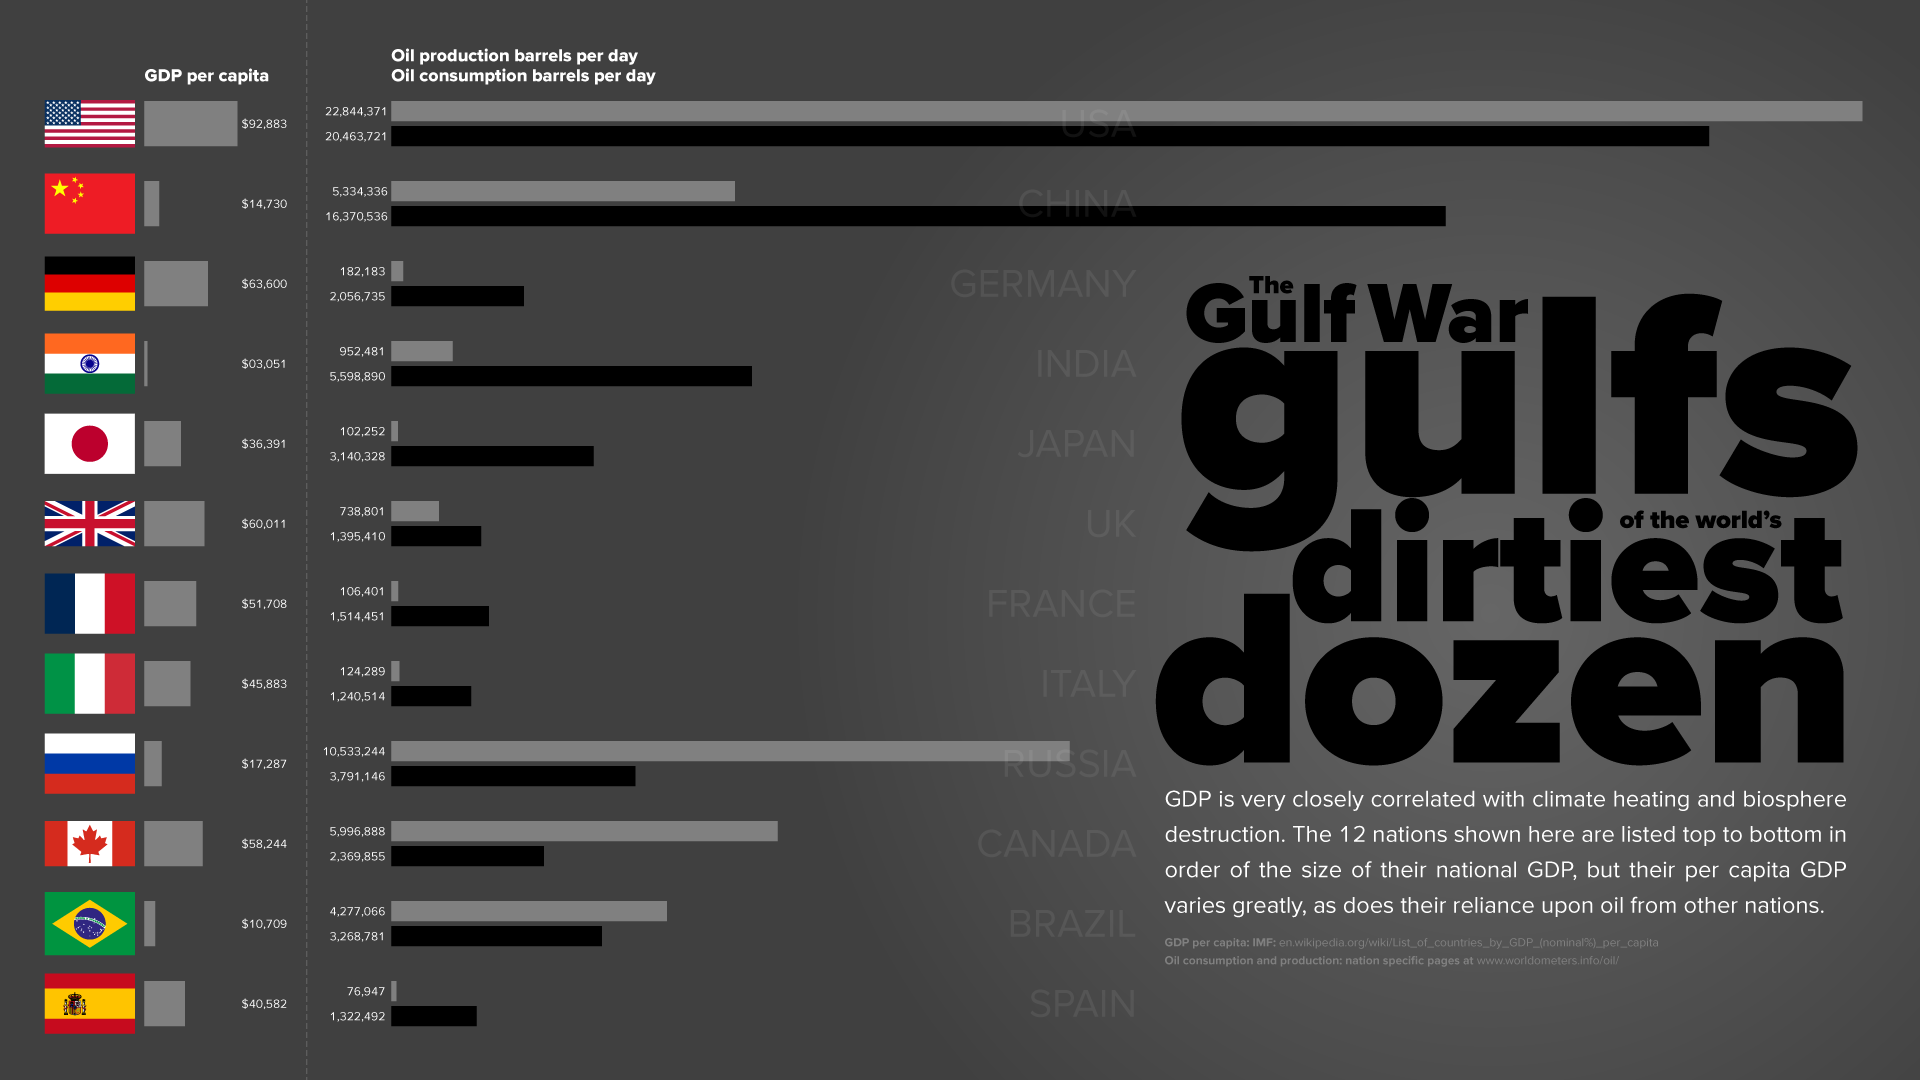
"content": "#climateDiary \n\nThe Gulf War gulfs of the world’s dirtiest dozen.\n\nGDP is very closely correlated with climate heating and biosphere destruction. The 12 nations shown here are listed top to bottom in order of the size of their national GDP, but their per capita GDP varies greatly, as does their reliance upon oil from other nations.\n\n- - -\n\nSources: \n\nGDP per capita: \nIMF: https://en.wikipedia.org/wiki/List_of_countries_by_GDP_(nominal%)_per_capita\n\nOil consumption and production: \nnation specific pages at: \nhttps://www.worldometers.info/oil/\nhttps://files.mastodon.social/media_attachments/files/116/313/243/214/498/410/original/458629fa35f6afa3.png\n",
"sig": "281c75ea2954977e247d610150fe6b12fc9adc42531082eb730effcd9d50edfa61363dcc67f8da13fad4aea56a68c3b18fdcf2a31c73d7abe12a4f4dbb3006fa"
}